PERFORMANCE & SEARCH MARKETING
Attract the traffic that matters most
Our platform offers comprehensive analytics, keyword and competitor research tools, and actionable insights to help you dominate search results and grow your business online.
See it in action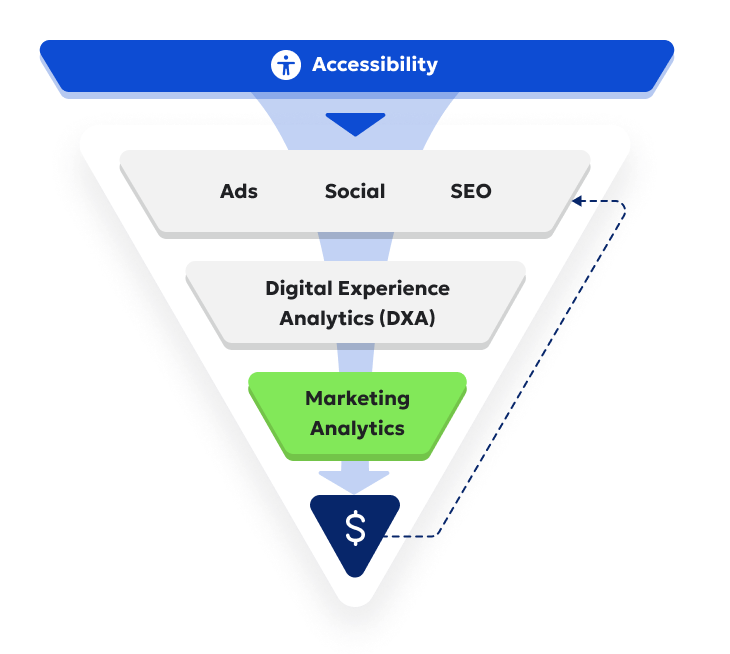
The missing link
Imagine a world where integrated SEO and ads data shows you where you're making progress and where you're falling short. One where your short-term efforts lead to long-term results. We've got just what you've dreamed of.
Why performance marketing matters
Integrated demand gen
Unify top-of-funnel and increase traffic with cost-optimizing Ads and SEO tools built to work together.
Cost-effective growth
Outrank the competition and drive traffic with keyword research and analysis products.
Performance tracking
Monitor progress and make data-driven decisions to optimize site performance.
Competitive advantage
Get insight into competitor websites, identify strengths and weaknesses, and improve your own ranking.
What we deliver
The right insights can take your marketing efforts from 'good' to off the 'charts' overnight. Fortunately, we’ve got all kinds of data designed to empower you and your team to do just that.

Integrated portfolios
Optimize your paid-to-organic mix with specific recommendations designed to help you maintain the right balance over time. Our proprietary insights can help you save on unnecessary spend, capture a larger share of search engine results pages (SERPs), increase brand visibility, drive more qualified traffic, and achieve higher overall conversion rates.

Content marketing
Build trust and credibility — while driving more qualified traffic. Effective content marketing fosters long-term relationships with customers and contributes to sustainable business growth.

Competitor research
Gain a competitive advantage with insights into your competitors’ strengths, weaknesses, and strategic focus. Our tool helps you uncover new keyword opportunities, content gaps, and niche markets that can help you beat your competitor to the customer.
Who benefits?
Product visibility and lead generation
Our SEO platform can optimize product pages and content to improve visibility in search engine results. This helps manufacturers attract more leads and inquiries from potential customers searching for specific products or solutions online.

Employ localized SEO for regional branches
Financial institutions with multiple branches or offices can leverage local SEO strategies to optimize each location's visibility in local search results. Our SEO platform can help in managing and optimizing local business listings, improving visibility among local customers seeking banking or financial services.

Deliver seamless PSAs and crisis communication
Ensure that citizens can quickly find and access information about services, programs, and regulatory requirements, reducing the need for direct inquiries and improving overall service efficiency.
But performance marketing’s not all we do...
Our platform transcends traditional boundaries to tackle the full range of digital requirements, optimizations, and impact-drivers.
Accessibility
Ensure that every visitor to your site has an equal experience, and that your business is fully compliant with all local and federal regulations.
QA & Custom rules
Boost your brand reputation with a site that’s consistent, high-quality, and functions as expected — and keep tabs on it in real time with fully automated, round-the-clock monitoring.
Designer & Developer Tools
Give the creators of your domain the tools to deliver an optimal digital experience from the minute coding starts, all the way through to deployment.
Content & Behavior Analytics
Understand how visitors are receiving your content and the responses it generates in order to make better targeted, more impactful decisions.
Journey & Funnel Analysis
Assess every step of your digital experience for strengths, weaknesses, and opportunities. Compare your efforts over time and iterate accordingly to continuously optimize your funnel.
Visitor Engagement & KPIs
Measure how your audience engages with your brand across a wide range of parameters, for an even more robust, informed view of how to influence their experience and actions they take.
Paid Search
Optimize paid search campaigns, streamline budget management, and enhance landing page performance by leveraging AI-powered insights and automated analysis.
Content Marketing
Leverage machine learning to make smarter SEO decisions and get AI-provided content suggestions to improve on-page engagement, sentiment, and conversions.
Competitive Research
Highlight opportunities based on market trends and competitor analysis that give you the edge to claim more digital real estate for yourself and outpace the leaders in your space.
Unified Search Insights
Consolidate paid and organic data for a holistic view that helps you pinpoint precisely how you can move the needle on the initiatives where it matters most.
Paid Social
View Facebook and LinkedIn ad performance and audience engagement data within a centralized dashboard to optimize ad spend, enhance campaign performance, and maximize ROI.
App Marketing (Coming Soon!)
Augment your visibility into the customer experience you offer with expanded insight across platforms for a more consistent, high-performing digital estate.
Feature you’ll love: Monitor a suggested SEO keyword
Even more valuable than keyword tracking are keyword insights — we’ll tell you precisely which ones you should be following, and how much traffic you stand to gain.
Your questions, answered
SEO, or Search Engine Optimization, is the practice of improving the visibility and ranking of a website on search engine results pages (SERPs). It is important because higher visibility in search results can lead to increased traffic, brand awareness, and ultimately, higher conversions and sales.
Keywords are specific words or phrases that people enter into search engines when looking for information. They are crucial for SEO because they help search engines understand the content of your website and match it with relevant search queries, thus improving your site's visibility and ranking.
SEO increases web traffic by improving your website’s visibility in search engine results. The main advantages include attracting more qualified leads, enhancing brand awareness, and achieving long-term, sustainable growth. SEO also helps build trust and credibility with users by ensuring your content meets their search needs, leading to higher engagement and conversion rates.
Considering both paid and organic traffic in your demand generation strategy is crucial because it creates a balanced approach that maximizes reach and efficiency. Paid traffic provides immediate results and can target specific audiences, while organic traffic builds long-term visibility and credibility. Combining both ensures you capture a broader audience, optimize spending, and enhance overall marketing effectiveness.
We use Intelligent Demand Gen Portfolios to maximize your online presence through a comprehensive strategy that integrates SEO and Ads. By optimizing your paid-to-organic mix and providing specific recommendations, our portfolios help balance your strategy, save on unnecessary spend, and increase your share of search engine results pages (SERPs).