DIGITAL EXPERIENCE ANALYTICS (DXA)
Your site’s high-value single source of truth
The easy-to-use analytics tool for peak site performance:
A glitch-free user experience
+65% time saving on web optimization
+28% conversion rates
Recognized as a leader in digital analytics
Siteimprove in action
The digital experience guardian for organizations just like yours


Analytics without anxiety
Intuitive to use and easy to set up for a clear path forward.
Content and behavior
Balance your paid-to-organic mix with Siteimprove’s proprietary insights. Save on unnecessary spend, capture a larger share of search engine results pages (SERPs), increase brand visibility, and drive more qualified traffic. All to achieve higher conversion rates.
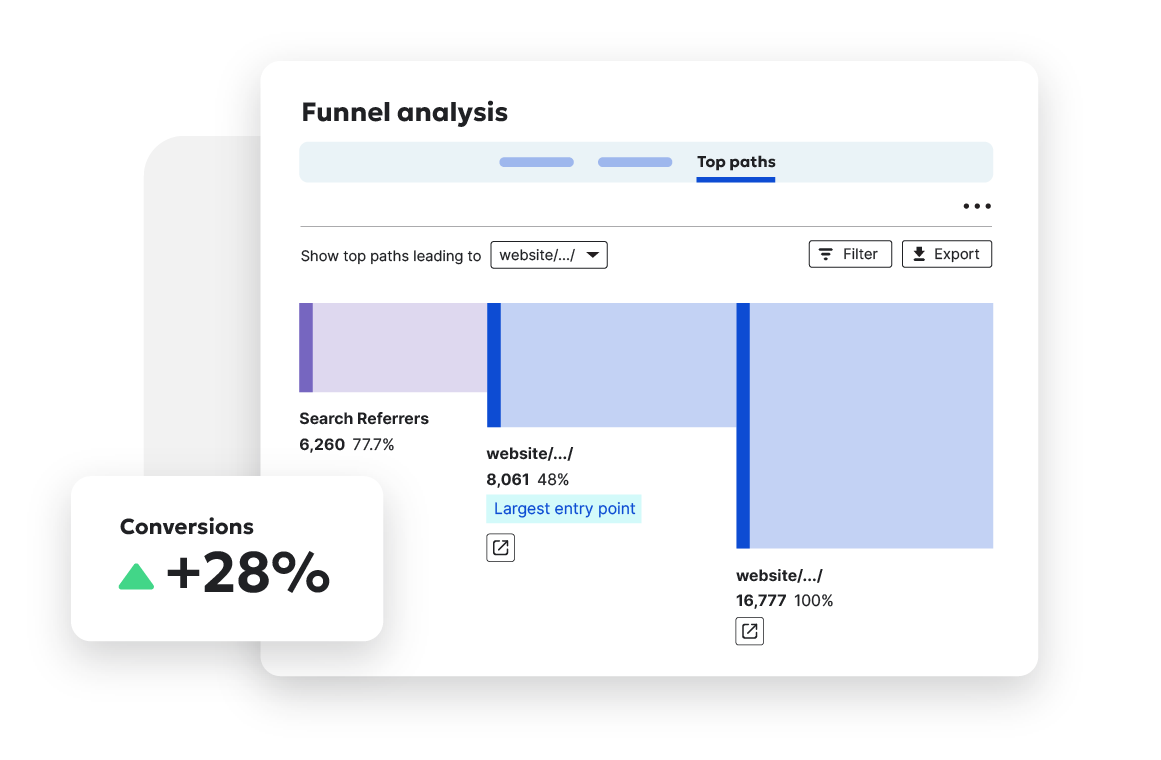
User journeys and funnels
Follow the paths your visitors take through your site. Spot where they drop off, cut friction, and optimize conversions. All without a data scientist on board.

Performance and KPIs
Sail through C-level presentations with confidence. Automatically track key metrics like conversion rates, site load times, and bounce rates from your dashboard. Then download the report and prove your work makes all the difference.

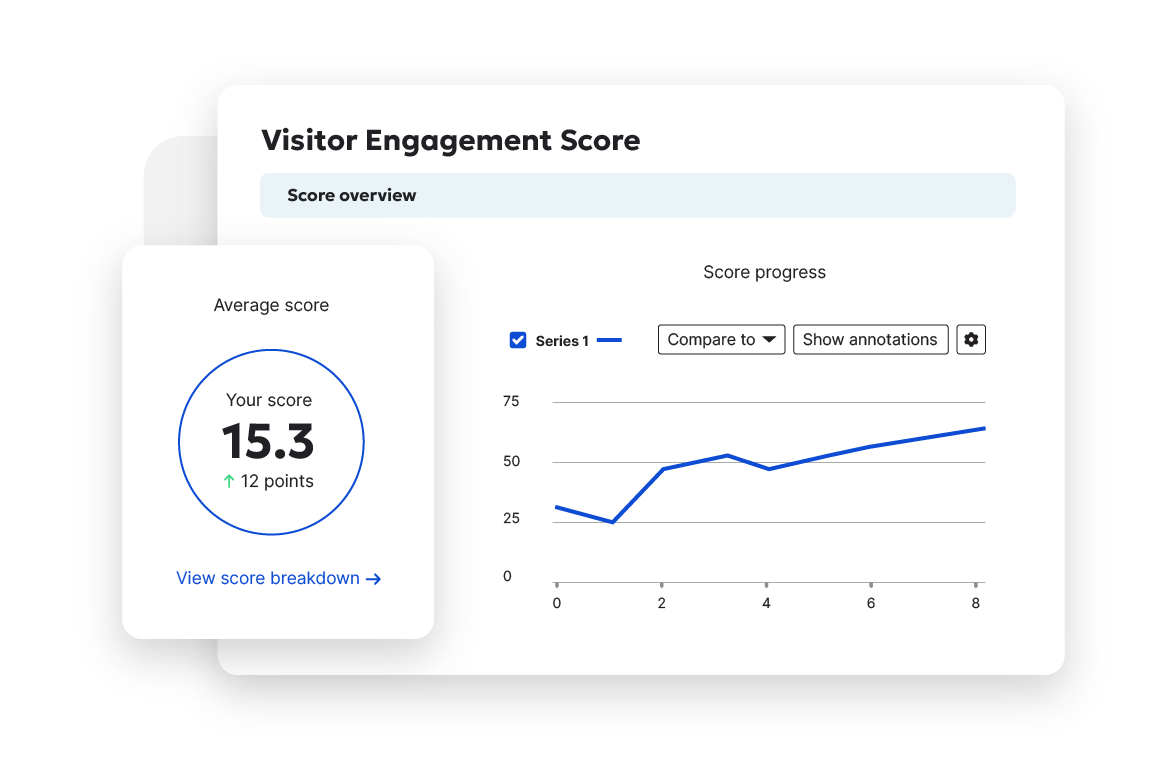
Visitor engagement score (VES)
Easily monitor engagement. Siteimprove tracks every action your visitors take, to give you a whole new metric. With the VES, you can monitor engagement over time to guide your digital marketing efforts.
Track behavior and clicks
Follow your prospects’ every move with heatmaps. See what content they love (and what they ignore). Plan your optimizations in response.
INTEGRATIONS
Siteimprove plays well with others
Your martech stack should make your job easier, not harder. Siteimprove integrates seamlessly with other top platforms.
-
 govAccess + Siteimprove
-
 Tridion + Siteimprove
-
 Sitebox + Siteimprove
-
 Percussion + Siteimprove
-
 Magnolia CMS + Siteimprove
-
 LRS Antilles + Siteimprove
-
 IPROX-CMS + Siteimprove
-
 Jahia + Siteimprove
-
 i:Create™ + Siteimprove
-
 Enonic + Siteimprove
-
 CoreMedia + Siteimprove
-
 Cascade + Siteimprove
Digital experience analytics success with Siteimprove sounds like:

Your questions, answered
Digital experience analytics refers to the measurement, analysis, and optimization of user interactions with digital platforms like websites. DXA focuses on understanding user behavior, identifying pain points, and improving overall user experience to enhance engagement, satisfaction, and conversion rates.
DXA provides insights into how users interact with digital platforms. By understanding user behavior, businesses can identify areas for improvement, optimize user journeys, increase engagement, reduce churn, and ultimately drive higher conversions and customer satisfaction.
DXA includes user behavior metrics (clicks, scrolls, navigation paths), engagement metrics (time on page, bounce rates), technical metrics (page load times, error rates), and feedback metrics (user surveys, satisfaction scores). This data helps create a comprehensive view of the user experience.
DXA can improve your website's performance by identifying bottlenecks and areas of friction in the user journey. By analyzing user behavior and feedback, you can make data-driven decisions to optimize site navigation, improve content relevance, enhance page load times, and ensure a smoother, more engaging user experience.
Heatmaps visually represent user interactions on a webpage, showing where users click, scroll, and spend the most time. This helps in understanding which areas of a page attract the most attention, identifying unengaged sections, and optimizing page layouts to enhance user experience and conversion rates.
Regularly reviewing DXA data is essential for continuous improvement. Depending on your business and website traffic, weekly or monthly reviews are generally recommended. Additionally, real-time monitoring for critical issues can help address immediate concerns promptly.