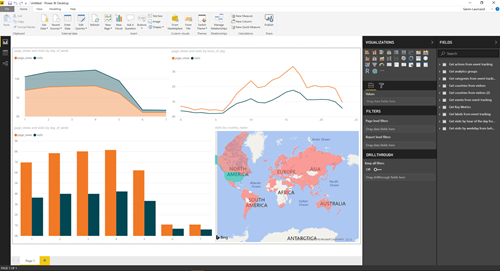
Power BI Connector

Learn how to connect to Power BI

Microsoft Power BI's data visualization capabilities work with Siteimprove insights to create an interactive way to share your data. With custom dashboards and multiple display options, you can now see your website’s results in a whole new light.

Connect Power BI and Siteimprove to easily monitor your website's performance directly from your Power BI dashboards, and discover the benefits of including your website's performance alongside your usual business metrics.

You must have Siteimprove and Power BI subscriptions to use this Connector.

The Siteimprove Intelligence Platform provides eye-opening insights that empower you and your team to create higher quality content, drive better traffic, measure digital performance, and work towards regulatory compliance—all from one place.

These are some of the insights you’ll get with your Siteimprove subscription:

  • Analytics: Understand what drives traffic and conversions and get behavioral insights with Heat, Click, and Scroll Maps.
  • Performance: Reduce load time and improve visitors' experience by identifying what’s slowing your pages down.
  • SEO: Rise above the ranks with 70+ automated checks, powerful keyword insights, and clear recommendations.
  • Policy Management: Ensure consistency and brand compliance by creating custom rulesets and regular checks.
  • Accessibility: Detect issues that impact usability, experience, and potentially keep visitors from converting.
  • Quality Assurance: Take content quality to the next level by automatically checking for broken links, misspellings, and readability issues.

The Siteimprove Power BI Connector (WDC) allows users to visualize Siteimprove data within Microsoft Power BI. The data is obtained via the Siteimprove REST API, which is available to all Siteimprove customers.

Download this step-by-step guide and learn how to connect to Power BI.