About half of customers say most companies fall short of their expectations for great experiences, according to Salesforce.
As customer expectations rise, marketers are forced to move away from traditional marketing tactics that focus on promoting the company, what they do, why they’re the best, and why customers should buy from them.
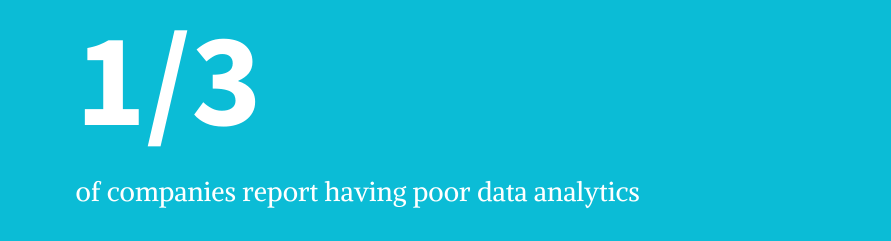
Marketers must now move towards a customer-centric approach that flips the old dynamic on its head. In order for marketing teams to succeed in doing that, they need to be intimately familiar with their customers’ journey. But that’s most likely easier said than done: in a recent report by IDG and Siteimprove, one third of companies reported having poor data analytics and 22% said they had poorly integrated systems.
Those sentiments were echoed in a Harvard Business Review and Salesforce study that found only a measly 13% of companies have a single source of customer intelligence today and only 30% are working towards it.
That likely means that you need to cobble together different data sources in order to get an informed understanding of what your customers’ journeys look like. Below, we’ll go into detail about how you can do that using data that’s already available or easy to implement.
What is a customer journey and why is it important?
Keep in mind that you aren’t creating a journey for your customers—you’re simply trying to discover the paths your customers already take.
As Jake Sorofman of Gartner says, “What’s important to remember is that customer journeys aren’t created; they’re discovered. When we try to create journeys, we fall into one of these two traps: we either hallucinate customer needs or throw away the customer experience playbook altogether and focus on the needs we know intimately: our own.”
When you discover customer journeys, you’re essentially trying to map out the flow a person takes when making a purchase or becoming a customer. When you do that, you can see the pain points, obstacles, and smooth areas of a customer’s journey and address them as necessary.
By mapping a customer’s journey, you can iterate site design, checkout experience, different types of content, and different conversion strategies. If you measure each of those points correctly, you can see if your iterations make a difference in easing the customer journey.
What does a customer journey look like?
As McKinsey and others have pointed out, the decision making process is actually more circular than linear, with each stage “representing potential battlegrounds where marketers can win or lose.”
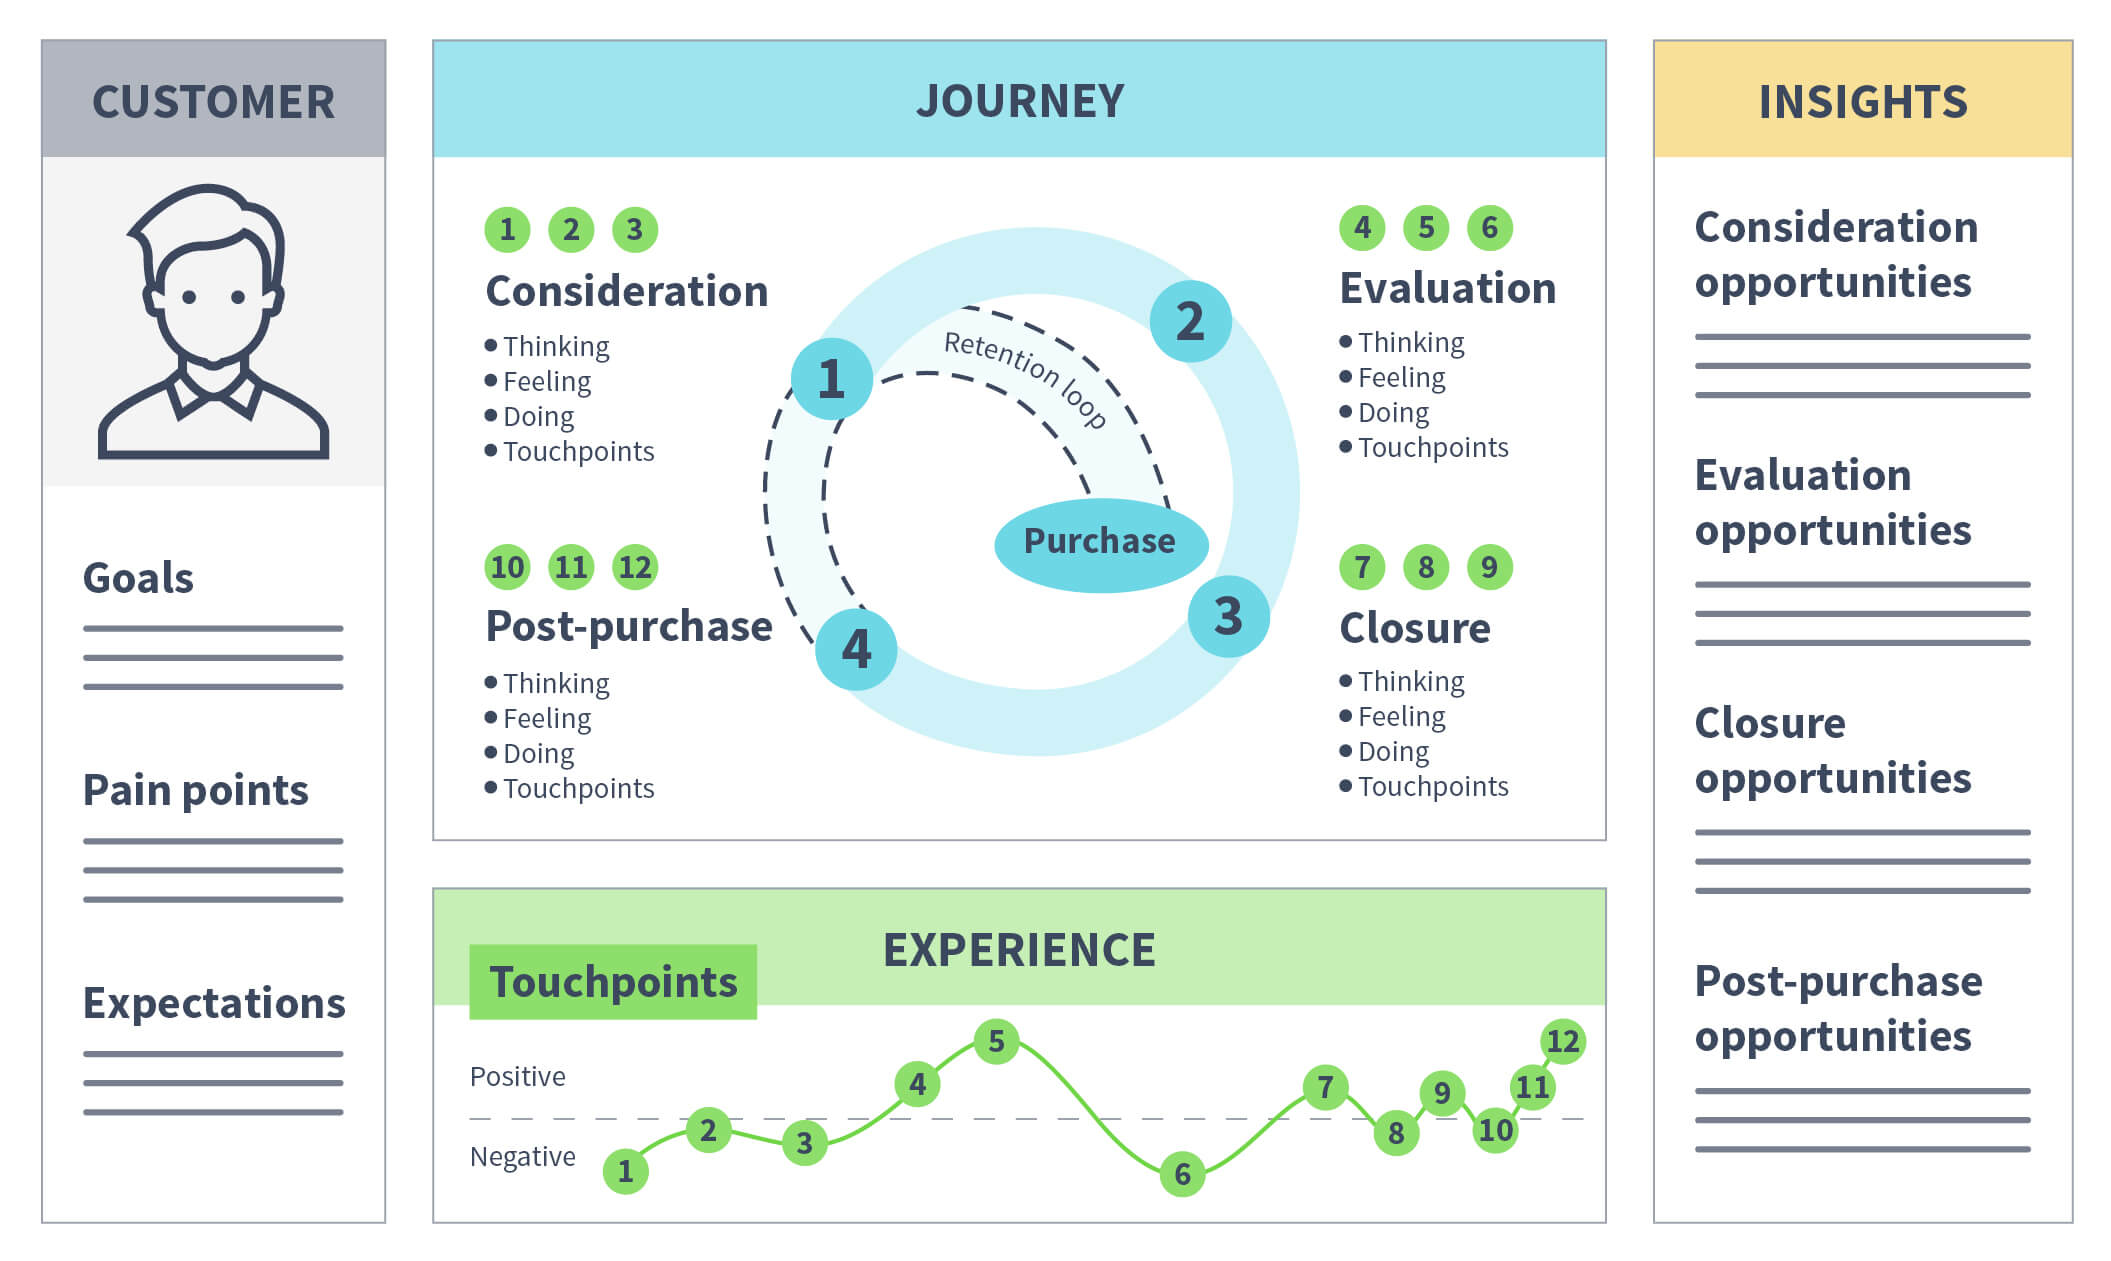
We’ll talk through four major stages of the circular customer journey: consideration, evaluation, closure, and post purchase. Of course, you might find that your own customers go through fewer or more stages. For each phase, it’s helpful to investigate what customers/prospects are feeling, thinking, doing, and any relevant touchpoints they have with your company.
Then, map the touchpoints out on a spectrum of positive to negative emotions. All in all, your customer journey will look something like this:
 But in order to create that customer journey, you need data to give you the basis for understanding your customers.
Why is data imperative for customer journey mapping?
You might wonder why you need to look into data at all when it comes to creating your customer journey. Surely you know your customers well enough to map their feelings, expectations, and intent?
As Jesper Termansen, Chief Marketing Officer at Siteimprove, explains, “Brands need to heavily invest in their data, as more and more customers expect the right experience delivered at the right time—and companies need trustworthy data to do that.”
Jake Sorofman puts it a bit more bluntly, adding, “many marketers conflate customer needs with their own, creating journey maps that are impressively articulate expressions of their own sales and marketing goals, but utterly tone-deaf when it comes to the customer.”
While that might sound cynical, there are a few very good examples of this fallacy in action. Ron Johnson is credited with making the American retail giant Target trendy, as well as with making Apple stores massively successful. He was hired as CEO of JC Penny to modernize an old (and dying) retailer with an old customer base.
Johnson’s time at JC Penny was a massive disaster in almost every way, as he overhauled the brand and stores, leaving loyal customers confused. One of the reasons why it was such a disaster is because he didn’t test his ideas on the customer base.
Assume nothing about your customers when you set out to discover the journeys they take when purchasing your product. Below, you’ll see how you can use your available data to discover the journeys your customers are on and what you can do to address pain points.
The consideration phase
The consideration phase is kick-started by an initial trigger, where consumers explore their problem (e.g. I don’t understand where my website traffic comes from and I need to look into a solution for it) or inspiration.
It’s also during the consideration phase that consumers compare and consider a set of brands, based on the reputation of those brands, initial exposure to that set of brands, ads, recommendations, etc. This is the starting knowledge a consumer begins their journey with.
During this phase, a brand can lose its spot in the set of brands being considered, while other brands can earn a place. It’s important for marketers to keep in mind this journey is fluid and ever changing—every stage is a battle to be won.
As you map out what the consideration phase looks like, use data to assess what your potential customers are thinking, feeling, doing, and the touchpoints they experience.
Available data in the consideration phase
Upper funnel content performance: If you haven’t done so, conduct keyword research for upper funnel search terms. You can start with a free tool like Answer the Public to see common questions that people ask about a specific topic. From there, you can create relevant content using those questions and search intent as guidance (search intent is the why behind each search) for your consideration phase content.
If you already have upper funnel content, make sure you track the performance and behavior with heatmaps and event tracking. Then, you can compare the performance of different topics, which will give you insights into which questions, topics, and content formats are most useful and interesting to consumers in the consideration phase.
Social listening: Once you’ve identified common keywords and topics your prospective customers are interested in, use a social listening tool to listen to organic conversations for keywords that are relevant to your target audience’s pain points. This will give you more insight into how your prospective customers think, the problems they face, and their honest opinions.
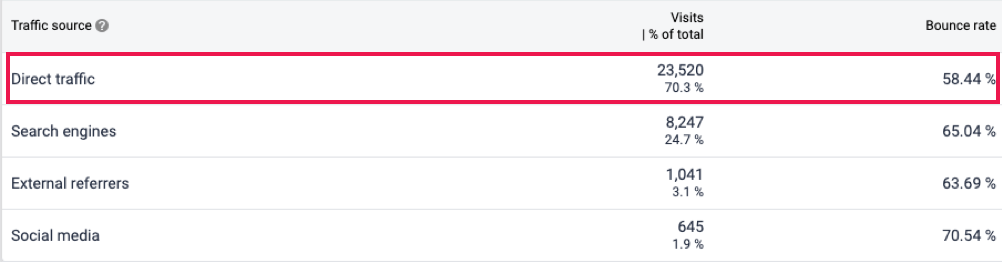
Direct traffic: Measuring organic traffic over time will give you a good indication of your online brand presence, but direct traffic is a better measure of how many people seek your brand out intentionally. In your web analytics tool, look at your direct traffic to see the number of visitors who went directly to your site (e.g. by typing the URL of your site instead of Googling something in order to find your site), and see how that compares to other traffic sources. If your direct traffic is low, you might not be that competitive in the consideration stage or that’s not how prospective customers find you on their journey.
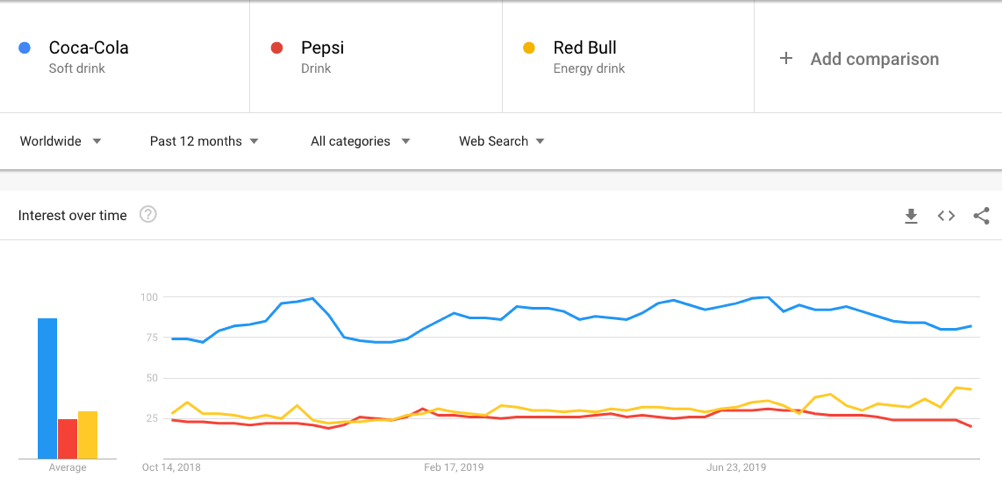
Search trends: You can see how you compare to your competitors in the consideration phase by using Google Trends. Search for your brand name and your competitors’ brand names to see how the search volume compares over time. This, of course, only gives you an indication of branded searches, but it still sheds light on how you stack up to the competition.
What your data should provide you
As you comb through relevant data for the consideration phase, try to assess what potential customers are thinking, feeling, doing, and the touchpoints they experience. Then, take the data you’ve collected and distill it down into the following customer journey format:
Thinking
“What’s the easiest way for me to figure out where my website traffic is coming from?”
Feeling
- Determined
- Uncertain
- Overwhelmed
Doing
Spending time in their current website tool to see if it’s possible to find the information they’re after. Searching for tutorials on YouTube, reading through blog posts to see if there’s a solution to their problem.
Touchpoints
- Paid social media posts
- High ranking upper funnel content pieces
- Articles ranking your brand vs. your competitors
The evaluation phase
By this point, your potential customers are informed and have done their initial round of whittling down their options. In the evaluation stage, consumers continue their research on a deeper level. They’re adding and removing brands from their list, comparing products, gathering information, reading reviews, consulting sources they trust, and looking at pricing information.
As you map out what the evaluation phase looks like for your customers, approach your data with the intention of figuring out what your potential customers are thinking, feeling, doing, and the touchpoints they experience.
Available data in the evaluation phase
Reviews: Aggregate reviews from various sites (Google, Capterra, G2 Crowd, Trustpilot, consumer review sites, etc.). Tag reviews with common themes, so you can categorize them based on both positive and negative feedback. You can also categorize them based on the customer journey stage they fall under.
Polls on product pages: If you don’t have polls enabled on your product pages, it’s a good idea to do so. Ask potential customers if they have all the information they’re looking for, if there’s anything they’re missing, etc. From here, look at the responses to see where you might be lacking information (especially where it concerns benefits your competitors offer).
Product/demo video views: If you have product videos or demo videos, make sure to look into your video analytics. Depending on which platform you use, you might be able to see location data for viewers, where viewers drop off, and at which point they’re most engaged.
If you have the ability to enable polls in your videos, try asking what viewers want to see more or less of in your product videos.
Product support forums: Depending on your industry, try searching Reddit, Quora, Hacker News, Product Hunt, or other sites for your brand name, products, or key terms (look especially for “[your brand] vs. [your competitor]” to see what people in the evaluation stage are saying). From here, you can start collecting common questions, pain points, and positive feedback and add it to your customer journey map.
What your data should provide you
When you look at your relevant data in the evaluation phase, assess what potential customers are thinking, feeling, doing, and the touchpoints they experience. Look specifically at questions, concerns, or hesitations that customers might have about your brand. Then, take the data you’ve collected and distill it down into the following customer journey format:
Thinking
“What’s the difference between these three solutions and which one fits my specific needs and budget?”
Feeling
- Energized
- Persistent
- Reflective
Doing
Reading reviews, asking their peers and network for advice and relevant experiences. They’re combing through different websites to look at features, pricing, and packages.
Touchpoints
- Product, pricing, and about pages
- Video channels and social media
- Contact form or sales
The closure phase
This phase is defined by the moment of purchase. The customer has done their research, has likely talked to sales or consulted a trusted source and is now ready to make a decision.
However, marketers shouldn’t assume the situation can’t change at this stage. Again, everything is up for negotiation and change on your customer’s journey. You can easily lose a customer at this stage.
As you map out what the evaluation phase looks like for your customers, approach your data with the intention of figuring out what your potential customers are thinking, feeling, doing, and the touchpoints they experience.
Available data in the closure phase
Email surveys: When a customer makes a purchase or creates an account, send them a short survey that asks about key issues in the closure stage:
- Where did you first hear about us?
- Why did you choose this product?
- What can we do to make setting up an account/purchasing easier?
This will give you a better indication of why customers are considering your brand and what their roadblocks are, so you can better address them.
Customer effort score: Customer effort score (CES) is a measure of how much effort a customer had to put into completing a specific task (in this case, a purchase). It probably goes without saying that customers don’t want to put much effort into a task; they want it to be as easy as possible.
If you don’t currently track CES, it’s very easy to implement as it measures the effort of a single task (not the customer journey as a whole). When a customer completes a purchase or creates an account, you can fire an on-screen pop up that simply asks, “how easy was it for you to purchase this product/ create an account?” You can measure the question from 1-5 or with a series of faces ranging from happy to sad.
Keep in mind that CES only measures a single transaction, not a customer’s experience with a brand as a whole. Still, when combined with other CX metrics, it can give you a better understanding of where you have gaps in your customer journey. According to the Harvard Business Review, “When it comes to service, companies create loyal customers primarily by helping them solve their problems quickly and easily.”
What your data should provide you
As you evaluate data from all of these sources, look out for actions or information that triggered the actual purchase.
Many customers abandon their shopping cart right before purchase, so it’s important to look out for triggers that either caused that or urged them on to purchase. Take the data you’ve collected and distill it down into the following customer journey format:
Thinking
“I’m really happy I’ve finally made a decision about which tool to go with. I think my team will be really happy about this.”
Feeling
- Relieved
- Expectant
- Hopeful
Doing
Sharing the news about a recent tool subscription with the team. Exploring the help center and getting started guides.
Touchpoints
- Conversations with sales
- Invoicing/billing
- Help center or resource center
The post purchase phase
The post purchase phase is everything that comes after the initial purchase, but before a second purchase or churn. This is not the time for marketers to rest on their laurels, but rather a key time to positively influence a customer’s experience, so they circle back to the consideration or closure stage.
In this stage, the customer is perhaps at their most critical or impressionable. They’re looking for the brand to deliver on the promise that was made about the product or service. They’re also likely to interact with customer service or an account manager.
In the post purchase phase, it’s important to look for data that indicates brand engagement/loyalty, or lack thereof.
Available data in the post purchase phase
Net Promoter Score: Net Promoter Score (NPS) is a measure of how likely customers are to recommend your brand, which gives an indication of customer loyalty.
NPS traditionally asks how likely customers are to recommend your brand on a scale from 1-10. NPS is then calculated by taking the percentage of promoters (those who answered 9 or 10) and subtracting the percentage of detractors (those answering 6 or lower).
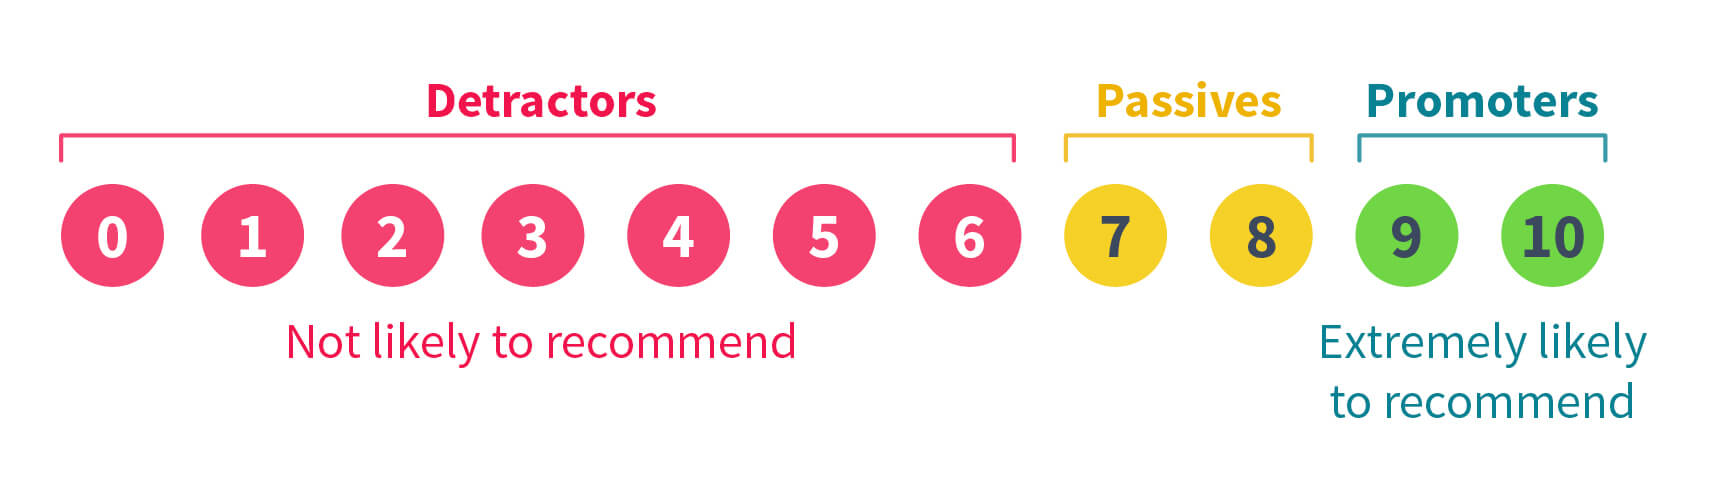
By monitoring NPS score over time, and drilling down into specific customer segments, you can track fluctuations in score and customer loyalty. Ask follow-up questions as to why customers gave the score they did, then group comments by theme in order to identify patterns in the overarching customer journey.
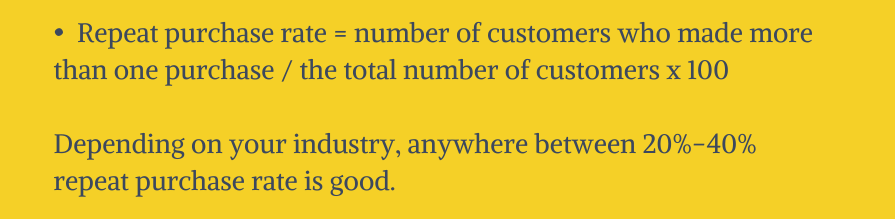
Repeat purchase rate: Ensure that you have the proper customer and web analytics set up so you can see if a customer has made repeat purchases, bigger purchases, or if there’s an upsell opportunity.
For ecommerce, you should look at repeat purchase rate.
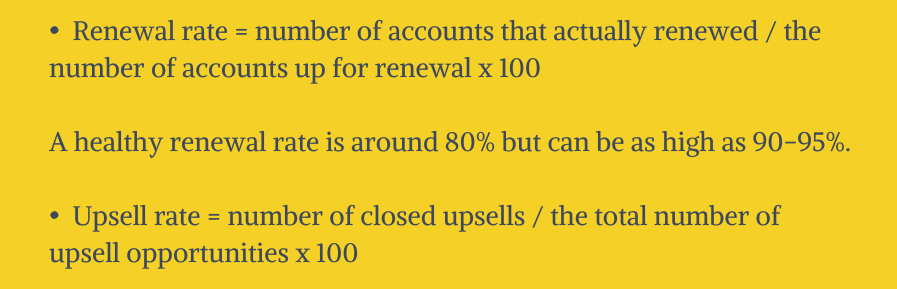
For SaaS and other service companies, look at renewal and upsell rate:
As with all loyalty metrics, track them over time to see any emerging issues and trends.
Content engagement: Look at customer newsletter engagement, time spent on page for returning visitors to your blog, internal website traffic, and exit rate. These metrics should give you an idea of how your existing customers and visitors engage with your content and where you might be losing them.
Customer surveys/ interviews: Sending customers surveys with open ended questions is an excellent way to understand where customers are on their journey with your brand. Consider asking open questions like the following:
- What was your [problem] like before you started using [product]?
- How would you describe your decision-making process when you decided to purchase [product]?
- How would you describe your experience purchasing [product]?
- How do you feel about our customer service?
- Would you buy/renew [product] again? Why or why not?
- What can we do to make your life as a customer easier?
Book 1-1 interviews with customers who have pain points or interesting insights that you want to drill deeper into. Then, you can use that data to assess what customers are typically thinking, feeling, doing, and the touchpoints they experience with your brand.
What your data should provide you
When you look through data that’s relevant for the post purchase phase, look for data that indicates engagement, a willingness to repurchase or renew, or anything that might trigger a customer looking at your competitors.
Take the data you’ve collected and simplify it into the following customer journey format:
Thinking
“I’m mostly happy with the tool I purchased. I have a few questions and there are some things that don’t work exactly like I was promised, but I’m happy with the explanations I’ve received from my account manager.”
Feeling
- Satisfied
- Contemplative
Doing
Using the tool on a regular basis. Training the team in how to best use the tool. Compiling feedback about how the tool could be better.
Touchpoints
- Blog
- Account manager
- Help center
- In tool messages
Learn more about customer journeys
To learn more about how marketers are creating better customer journeys and the challenges they face in doing so, download our recent report done alongside IDG.